Index Charts and Commentary for Week of March, 16, 2012
I hope everyone had a great weekend!It was an outstanding week for US markets with new "recovery" highs for most major indices. Getting right to the charts today we start with the S&P 500 index (SPX) below. It now seems likely that even in the event of a pullback we should find significant buying support around those 2011 highs at 1370. That's about a 2 1/2 percent correction from here. Technicals improved this week with stochastics reversing higher and avoiding a confirmed turn out of overbought and with a strengthening in MACD. While we remain cautious on the macro fundamentals it is difficult to argue with this price action. From a technical standpoint most evidence points to a continuing rally for now.
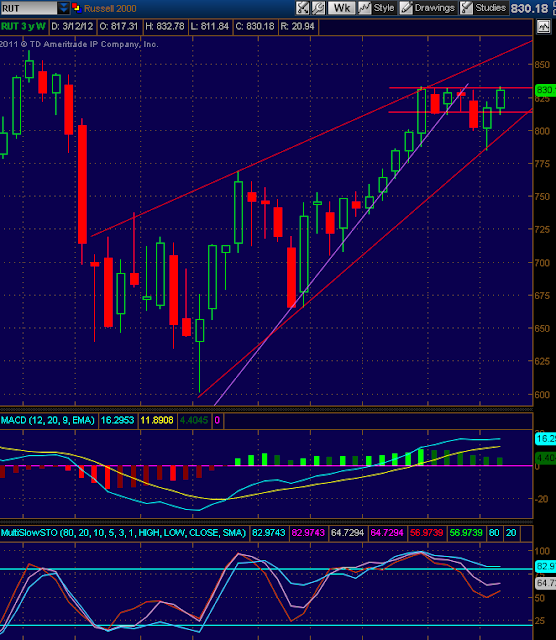
The small cap Russell 200 index has been an interesting one to watch over the last few weeks with this week being no different. The improvement in technicals this week was pronounced despite a slow start and after regaining its channel it went on to move quickly back up to the upper bounds of that channel. This has been stubborn resistance and it has failed so many times now one would think it will soon resolve one way or another. Either with a convincing break through and a shot at its own 2011 highs or a failure and sharp break down to new lows of the year.
MACD flattened out from its decline this week while stochastics avoided confirming the turn out of overbought. These are just the sort of improvements we had written previously that we needed to see and this index has gone from ugly duckling to diamond in the rough in the process. A break of that channel resistance should position the RUT for outperformance under any scenario of continuing market strength.
And last up as usual we have the VIX. One way or another our VIX bottoming thesis is going to see a resolution imminently. It was a wild week for the VIX and at one point it even reached levels not seens in nearly 5 years, at 13.99 low. Indeed it finished the week not far from there at 14.47, a decline of about 8.4%. We feel this may be the culmination of the bottoming process but it if is not then we should know that very soon. As we said, one way or another resolution is coming for this view. The white line tacked on below represents what we would probably need to see in the way of a breakout for confirmation of this.
See you for our manic monday report! Stay safe out there!


No comments:
Post a Comment