Showing posts with label Market Updates. Show all posts

Monday, March 26, 2012

Market Madness Market Update - 3/26/12


A spectacular day for US indices. Even though we're not doing market updates anymore today was too good to pass up.

The S&P 500 today took back all of its losses of prior days and more. The index closed at its highs of the day on some last minute buying acceleration to finish at 1416.5, a new high. Wedge resistance is coming up at around 1425 but it's getting narrow here and soon it will resolve and break on way or another. Probably for a correction downward. The market sure does seem to have one coming after a move this large, and this fast.

stock market updates index chart updates picture - SPX

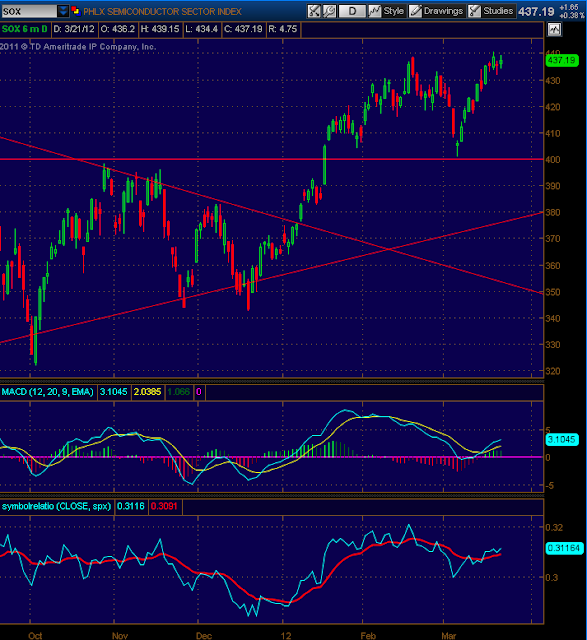
We were bullish on the semiconductors is some of our last updates and today it finally broke resistance at 440. If bullishness in the general market continues this index very well could be set for some great gains.

stock market updates index chart updates picture - SOX

And by far the biggest winner of the day, the small cap RUT index. Bye bye you cruel channel. This is going to be the place to be if market strength continues. We've been saying that for awhile now and it has been true for awhile now. Even Goldman Sachs has picked up on it and jumped on the Market Madness bandwagon (OK OK, so maybe they came to their own conclusions based on their own analysis and aren't actually reading our blog...)

stock market updates index chart updates picture - RUT

That's it. Just had to post those lovely charts and say a quick word. I'm NOT doing market updates anymore, I swear.

Wednesday, March 21, 2012

Market Madness Daily Market Update - 3/21/12

Daily Stock Market Update and Index Charts for March, 21 2012


US indices traded around their flat lines for most of the day today with the conclusion being mixed results at the closing bell. The DOW saw the most downside pressure with a close at 13124 for a 45 point, -0.35% loss for the day. The S&P 500 index (SPX) fared a tad better losing just 2.63 points to close at 1402.89, a -0.19% loss. While the tech composite (COMP) did even better finishing just on the other side in the green for a 1.17 point, 0.04% gain for the day to close at 3075.32. A relatively calm day today, our volatility measure, the VIX, gave up about half a point to close just above 15 at 15.13, a 2.89% decline.


Moving on to our charts today first up is the S&P (SPX). Unsurprisingly technicals deteriorated somewhat today with MACD further declining and both trend and momentum indicators losing some ground across the board. Our multi-stochastics indicator, however, has not yet confirmed its turn out of overbought territory. Right now most evidence seems to point towards this being a "cooling off" period before the next leg rather than a full-on profit taking situation. Of course, anything could happen tomorrow as we all know all too well.

daily stock market update with index chart for SPX

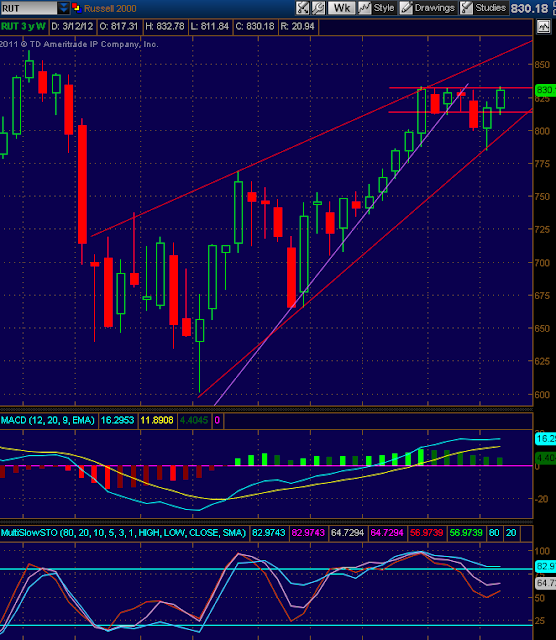
The small cap RUT index "outperformed" today by actually gaining a little ground. A very very little ground. Now right back in its long-standing channel this index has a bit of work to do before undoing the technical damage caused by Tuesday's losses. Assuming it can overcome those obstacles the RUT should still be in a good position for relative outperformance. We'll need to see either this 820-830 area successfully tested as new support or a convincing break of its recent highs to get back on the bull side of this trade. Overall technicals did worsen for the index despite the meager gains.
MACD fell a bit farther today but the RUT : COMP ratio flattened out a bit which certainly could be a positive if followed through on. Our multi-stochastic measure, however, is on the verge of confirming its rollover out of overbought. Which could actually be a good thing--relieving that pressure--if this is the worst of it, or at least close to the worst of it.

daily stock market update with index chart for RUT

The semiconductors truly did "outperform" today. The SOX index posted gains of 1.65 points to close at 437.19. A gain of 0.38%, besting its peers by a wide margin. We remain relatively bullish on this index if it can crack that resistance at 440. Technicals here were mixed today and provide little insight overall. MACD deteriorated a bit, stochastics continue to turn out of overbought, and the SOX : SPX relative strength measure showed improvement. Both trend and momentum indicators of a wide variety are showing mixed results and right now price action is the very best indicator for this index (well for any index any time, really).

daily stock market update with index chart for SOX

Still not feeling well so that's it for today folks!
Stay safe out there!

Tuesday, March 20, 2012

Market Madness Daily Market Update - 3/20/12

Market Update and Index Charts for March 20, 2012

Due to a nasty cold we're going to attempt to keep it very brief today.

US markets pulled back a bit today with the DOW losing about -.5% to close at 13170 and the S&P 500 giving up just over 4 points, or -0.3% to close at 1405. The tech composite (COMP) shed a mere 4 points -(0.14%) to close at 3074. All closed well off the lows of the day after a morning gap down followed by steady improvement through the rest of the day.

The SPX pulled back from the top of its ascending wedge formation this morning but fought back up to close well within Monday's range. That's a plus. On the negative side, however, the narrowing of losses throughout the day was not enough to prevent some technical weakening. MACD flattened out, the SPX : RUT relative strength ratio turned up, and stochastics started to turn out of overbought territory. None of this is damage that couldn't be undone with a strong day or two.


The small cap Russell 2000 index (RUT) saw the worst of it and did not recover from the morning gap down nearly as well as other indices. For the day it posted a loss of over 1%, or 8.53 points to close at 829.24. Right back inside that long-standing channel. The big question now is: will this level now provide some support? Technicals took a fairly sharp turn for the worse today with MACD turning down and the
RUT : COMP ratio continuing its decline. Stochasitics also rolled over steeply today but are not yet all in agreement. We should get more clarity very soon.


Is the VIX bottoming thesis dead? (long live the VIX bottoming thesis?)
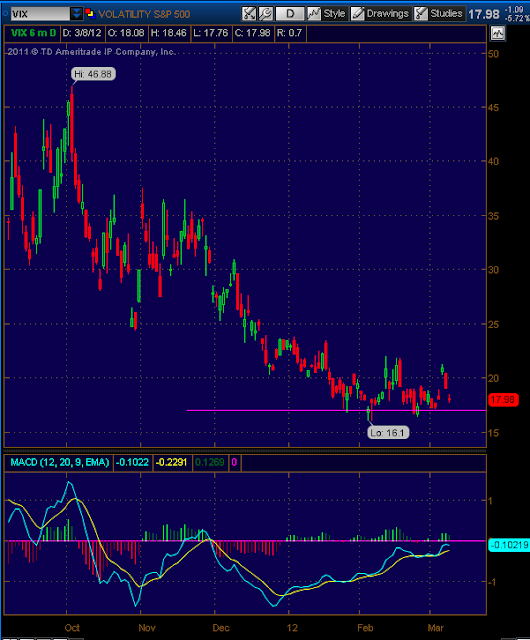
Well we report you decide but it looks like a distinct possibility. Personally we would need to see a fairly sharp move up to above the red line there around 19. And we would need to see it relatively soon. Like by the end of next week tops.Failing that occurring we would be very cautious on drawing any conclusions at all from VIX action in the near future. The VIX gained about 4% again today with .56 point rise to close at 15.60. That is a rise of about 14% from its lows but at these extreme lows moves of that magnitude--in both directions--are not uncommon at all and really do not impart any useful information.


Monday, March 19, 2012

Market Madness Daily Market Update - 3/19/12

Daily Market Update and Commentary for March 19, 2012


Another day in the green for the major indices today.

The DOW had the weakest showing with a paltry 6.5 point, 0.05% gain to finish at 13239 at the close.
The CBOE Volatility index (VIX) advanced today despite the gains in the SPX with a .57 point, 3.94% move up from its very low levels to close at just over 15.

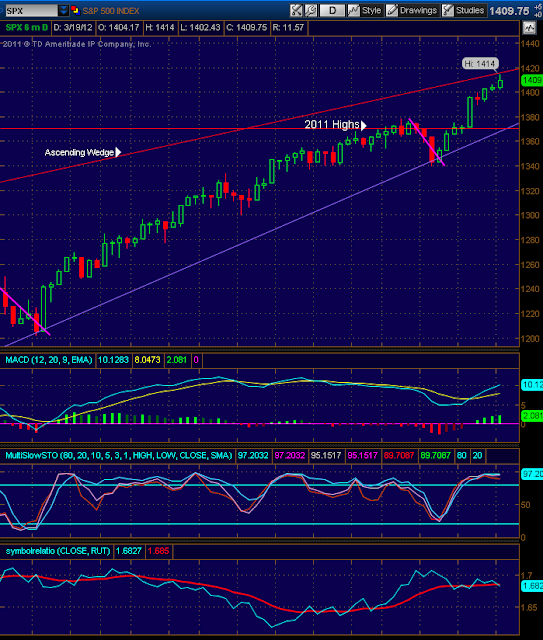
The S&P 500 had a much better showing than the DOW and was up almost 10 points late in the day before settling down a little to finish at 1409.75. A respectable gain of about 5.5 points, or 0.4%. The index backed off its highs after approaching the top of our ascending wedge formation but it is quickly running out of room and this will resolve one way or another imminently.

Technicals further improved with MACD gaining more ground and the SPX : RUT moving lower once again. A positive for continuing market strength. Stochastics remain in overbought territory on the daily time frame but show no signs of rolling over yet.

Stock market index charts and analysis - SPX


The start of the show today was, of course, the small cap RUT index. We've been increasingly bullish on this index starting after the first week of March (see here, herehere, etc.) and its break today of that stubborn upper channel resistance may bring a new phase to this rally. It should, at the very least, now have a solid base of support around the 830-820 level. For the day the index saw a gain of about 7.5 points, 0.91% to close at 837.77.
A handy outperformance of its major peers.

We love this index under any conditions of continuing overall market strength and it has a high probability of continuing outperformance of its peers under this scenerio.

Stock market index charts and analysis - RUT

The semiconductors (SOX) also performed admirably today with 0.75%, 3.28 point gain to 438.69 at the close. We've been constructive on this index as well lately (here, here) but this one is now sitting right at technical resistance. If, however, it can break convincingly through that 440 mark it too should have some more room to run for relative outperformance. Technicals also saw improvement here today with both MACD and Stochastics registering gains.

Stock market index charts and analysis - SOX


Take care and stay safe out there!

Sunday, March 18, 2012

Market Madness Weekly Market Update - 3/16/12


Index Charts and Commentary for Week of March, 16, 2012

I hope everyone had a great weekend!

It was an outstanding week for US markets with new "recovery" highs for most major indices. Getting right to the charts today we start with the S&P 500 index (SPX) below. It now seems likely that even in the event of a pullback we should find significant buying support around those 2011 highs at 1370. That's about a 2 1/2 percent correction from here. Technicals improved this week with stochastics reversing higher and avoiding a confirmed turn out of overbought and with a strengthening in MACD. While we remain cautious on the macro fundamentals it is difficult to argue with this price action. From a technical standpoint most evidence points to a continuing rally for now.

S&P 500 (SPX) Index Chart and technical analysis

The small cap Russell 200 index has been an interesting one to watch over the last few weeks with this week being no different. The improvement in technicals this week was pronounced despite a slow start and after regaining its channel it went on to move quickly back up to the upper bounds of that channel. This has been stubborn resistance and it has failed so many times now one would think it will soon resolve one way or another. Either with a convincing break through and a shot at its own 2011 highs or a failure and sharp break down to new lows of the year.
MACD flattened out from its decline this week while stochastics avoided confirming the turn out of overbought. These are just the sort of improvements we had written previously that we needed to see and this index has gone from ugly duckling to diamond in the rough in the process. A break of that channel resistance should position the RUT for outperformance under any scenario of continuing market strength.

Russell 2000 (RUT) Index Chart and technical analysis


Another potentially attractive area were market strength to continue is the semiconductor index (SOX). This index is just in great shape and with its recent successful test of 400 and subsequent strong rally could be getting set to run. Any cross over 440 should establish a nice base from which to continue the move on up to its March '11 highs at 474. Technicals also improved markedly with MACD advancing and stochastics turning around sharply.

Semiconductor (SOX) Index Chart and technical analysis

And last up as usual we have the VIX. One way or another our VIX bottoming thesis is going to see a resolution imminently. It was a wild week for the VIX and at one point it even reached levels not seens in nearly 5 years, at 13.99 low. Indeed it finished the week not far from there at 14.47, a decline of  about 8.4%. We feel this may be the culmination of the bottoming process but it if is not then we should know that very soon. As we said, one way or another resolution is coming for this view. The white line tacked on below represents what we would probably need to see in the way of a breakout for confirmation of this. 

VIX Volatility Chart and technical analysis

See you for our manic monday report! Stay safe out there!

Friday, March 16, 2012

Market Madness Daily Market Update - 3/16/12

It was a relatively uneventful day for the major indices with flat finishes across the board with slightly more selling than buying taking place. Our Friday update will therefore be brief as usual and we'll see you back here on Sunday for our Weekly market updates and index charts.


Have a great weekend!


The standout winner of the day was Bank of America (BAC) with a 6% gain of 58 cents to close at $9.80. It was just four short days ago that this stock was at $8. That's a gain of  %22.5 in four days! Incredible. And there couldn't be a less deserving company (well OK, there probably could be a less deserving company out there somewhere...)


The DOW shed about 20 points to close at 13232 for a 0.15% loss for the day which tracks right with other indices. The tech composite (COMP) gave up a little less barely even registering a loss at -0.04%, or 1.11 points. The VIX on the other hand plunged again today, losing almost a whole point from its already historically low levels to close at 14.47. A loss of over 6%. As noted in updates of the last few days this has begun to put into serious question our view in prior weeks of a VIX bottoming process. Time to reevaluate.


Charting only the S&P 500 (SPX) and Russell 2000 (RUT) today first up is the SPX. Finishing barely in the green today with a 0.11%, 1.57 point gain this index remains quite healthy. If positive sentiment continues there is no reason why the index shouldn't go on setting new highs for the time being. There is certainly little technical resistance to doing so. MACD further improved on the daily frame while our MultiSlow-Stochastic readings appear to be turning in agreement with each other. That latter could be a sign of impending correction of some sort and indeed, we do find a modest correction down to the major trendline/2011 highs to be the most likely outcome.


We pointed out yesterday that the RUT was right back at its upper channell resistance yet again and that this has been a big challenge for the index. And once again, we pulled back off that resistance to close lower by 0.15%, or 1.28 points. Between the small magnitude of the loss and today's environment of overall market weakness we can't learn anything from today about the likely relative performance of this index going forward. Monday should provide more clarity on the situation.


Thursday, March 15, 2012

Market Madness Daily Market Update - 3/15/12

Index Chart Updates and Analysis for March, 15 2012


S&P 500 Tops 1,400 On Economic Reports
U.S. stocks advanced, sending the Standard & Poor’s 500 Index above 1,400 for the first time in almost four years, as data showed manufacturing in the New York region unexpectedly increased and jobless claims declined.
Macro news continues to follow the market upward. The market has led the news this entire rally and the increasingly positive macro measurements are putting the bear case in serious doubt. That is, of course, if the numbers can be trusted and are not just being manipulated or propped up by expansionary policies. At Market Madness we don't consider that possibility to be all that far fetched, however.

Most major indices finished at or near their highs of the day for gains of around 0.5% With the small cap Russell 2000 index outperforming on a gain just under 1%. The VIX was basically flat for the day creeping up from 15.31 to 15.42 for .11, 0.72% rise.


The S&P 500 index (SPX) finished right at its highs of the day with a gain of 8.32 (0.60%) points to 1402.6
With another strong day for buyers this market continues to impress (and sometimes baffle). Technicals also further improved with MACD gaining some steam and a return to a declining SPX : RUT ratio. The "projected" lines on the chart below represent nothing more than a "most probable" outcome based on purely technical analysis and, without further supporting evidence, should be given little more weight than any other guess.


Semiconductors had a great day today with a 2% gain for the SOX index. We noted in our weekly market update of 3/2/12 that this it was approaching an important support level to the downside and to look for a bounce off that level (at 400). After that actually did come to pass we then voiced the view in our daily market update for 3/7/12 that this index could run faster, and farther than other indices on continuing market strength. It may now be approaching some overhead resistance around the 440 level and more caution is prudent for now until we see how price interacts with that level.


The RUT outperformed its peers today with a gain of 8 points for 0.98% to close out the day at 831.46. After this day of respectable gains for the RUT it is now right back up against that channel support. And once again it is clearing this level that is, and has been, the major hurdle for this index. This will be a chart to watch tomorrow. If it can finally break that barrier this index should be best positioned for relative outperformance in an environment of overall market strength.


As always Good Luck and Stay Safe!

Market Madness Daily Market Update - 3/2/12


Market Madness Financial Headline of The Day:
Yelp! IPO Soars 60% Despite Mixed Reviews
"Yelp! sold 7.1 million shares at $15 which was above the targeted $12-$14 range and valued the money losing venture at just under a billion dollars."
Market Madness recommends its readers stay far away from this turd.

Also worth mentioning before we get to the indices was the action in crude today, which has pulled back a bit from yesterday's level to trade currently at around $106.50, a retracement of over 2%. Market Madness believes crude may not be done with its move, however, and expects to see further upward price pressure in coming weeks.


Well, for the S&P 500 it was another day of oscillating around that 2011 high water mark of 1370. Not surprisingly, that's also where it ended the day, down about 4.5 points at 1369.63. Despite this decidedly mild selling, overall this index chart remains fairly healthy and technicals, while weakening, remain net positive. With that said, Market Madness advocates for a "wait and see" approach to this index as long as it continues to flirt with this important level.


Moving on to small caps we can see the profound weakness in this index with even a superficial look at its chart. In addition to losing its trendline support earlier in the month we now have a convincing break below channel support of the last several weeks. We have previously advised readers to keep a very close eye on this index and this is just the sort of thing that we were keeping our eyes out for. We feel that this is the most probable place for any significant selling pressure to appear first. And it now appears that may in fact be what is happening here. Though it is too soon to have much certainty.

One reading of particular note today is that of our SPX/RUT and RUT/COMP relative strength ratios.  These are found at the bottom of all our daily charts and as you can see small cap relative strength readings have plummeted dramatically since late last week. Another blog that has been harping on this disconnect here--even more than we have--notes this afternoon that the one-day reading of this divergence exploded today, with a reading of almost 4 to 1.
That posting apparently came a bit early, however, because by the end of the day that reading was actually almost 5 to 1! (-1.57% RUT/-0.32% SPX). This should not be comforting to buyers.


We wanted to touch just very briefly on the Semiconductors today. The semiconductor index (SOX) has had it nearly as bad as the RUT lately and if this keeps up it could have negative implications for tech indices. As it stands now it is simply something that bears watching but if we were to see a rapid deterioration from this level we would get much more cautious on the other indices.


Don't forget to check back on Sunday for your Weekly Market Madness Recap!
Have A Great Weekend Everyone!

Wednesday, March 14, 2012

Market Madness Daily Market Update - 3/14/12


Quick Headlines:
Commodities got whipped today with Gold and Silver taking an especially rough beating.
Big winners for the day included AAPL with a 21 point, 3.8% gain and BAC (ugh) with a gain of just over 4%

Major indices were both flat and mixed today with the one major exception being the small cap Russell 2000 index which gave up just under 1%. We'll get to that in more detail later on below with its chart. The DOW and the tech composite both managed to finish the day slightly in the green with gains of +0.03% and +0.12% respectively. Just holding on to the great gains of yesterday can be considered a big win for the bulls today.

Our first chart today is the SPX (which we prefer over using the SPY ETF as a proxy). The S&P 500 today shed just 1.67 points down to 1394 which, on a percentage basis, is exactly what the DOW gained, 0.12%.
This again can easily be seen as a win for the bull camp and in addition many technicals also continued to improve today. We feel that a correction down to the 1370 level is both probable, and important to building a new base from which to continue the bull run. A successful test and bounce up would be a strong sign of health while a failed test and break under would be more ambiguous. You can see our projection of the most likely progression from here drawn as the white lines in the chart below. Of course, it may also not even move to test that level and just continue on from here. We are also approaching the top of an ascending wedge formation. MACD confirmed its crossover today despite the minor losses but the SPX : RUT ratio reversed higher on the RUT's pronounced under-performance. 

 traderush binary options trading platform review

Which brings us to the RUT chart. We had mentioned yesterday that of all the major indices the RUT faced the most immediate potential for resistance. The index had finished the day yesterday sitting right below prior channel resistance of the last 45 days. And as noted in today's intro this index had by far the worst day of the bunch losing almost 8 points, for a -0.94% decline. Now sitting in the middle of that channel it would be interesting if it simply resumed its sideways movement from here. Despite the losses of the day it wasn't enough to negate the MACD crossover into "buy" territory. However, the RUT: COMP ratio (as previously mentioned) obviously reversed sharply lower on today's under-performance. This reversal was of a large enough magnitude to put into question the previously developing turnaround in that RUT : COMP relative strength measure.


We want to touch only briefly on the tech composite today. This index also experienced an MACD "buy" crossover signal today while our COMP : SPX ratio continued to climb. We are now, however, bumping right up against the prior trendline but this probably won't pose much problem if overall market strength was to continue.


The VIX rose moderately today with a 3.5% gain of half a point to finish at 15.31 at the close. MACD averages are also getting quite close to crossing above the zero line for the first time since December. The white line tacked on to the end of the price action in the chart below represents what we feel would constitute a breakout. If this move were to develop it would almost surely drag MACD lines above that zero line and we believe it could easily move very quickly from there into the mid-20's. If this move fails to materialize over the next two-weeks then our bottoming thesis would be in serious question and would need to be carefully reevaluated.


Stay safe out there!

Tuesday, March 13, 2012

Market Madness Daily Market Update - 3/13/12

Market Update for March, 13th
The "Market Madness" moniker is certainly appropriate today.

There were some market driving events and headlines today and it made for a wild ride but at the end of the day it was the best day for markets this year. In a year with a lot of good days so far.

The FED's FMOC met today which was one driving event of course. Though the outcome of the meeting was mostly unchanged wording the FED did report that they see a "Slightly improving economy."
From Reuters: "Fed holds steady course, offers few clues on future."

Treasuries also fell sharply with yields rising to 2012 highs. The highest yields since October 2011 actually. No surprise there with the strength seen in equities today. In other indices the DOW rose to its highest level since 2007, closing at 13177 for a roughly 1.7% gain, the least of all major indices but still impressive. The Composite breached the 3000 level again but this time leaves a little room for pullback and is in a better position to challenge higher levels than previously. Assuming a continuing strong market, of course.

On to our charts for the day. The SPX started the morning with a strong gap up to 1378 and then spent most of the day after that gently drifting upwards until late afternoon. The final hour of the day saw some fireworks though and it was buy buy buy from then until the close, where we finished the day at just over 1396. A gain on the day of over 1.8% and 24.9 points. Its best day since mid-December. It was enough to trigger a MACD crossover signal back over into green and the SPX : RUT relative strength measure continued to improve as well. We are no doubt approaching some overhead resistance at these levels and the area between 1400 and 1420 is probably going to be tougher to cross than the preceding 40 points or so. We should probably expect to see a mild pullback early on tomorrow but whether or not sellers can hold the day is in question.

The final hour burst, by the way, was probably brought to us courtesy of JP Morgan with a huge stock buyback program and some helpful leaking of positive "stress test" results.


The small cap RUT index continued to show marked improvement today. Both in absolute terms (obviously) and relative terms vs. other indices. Technicals improved across many measures and MACD in particular appears to be headed for imminent crossover into the green for the first time in a month. Our RUT : COMP relative strength proxy also inched up a bit today, with underlying indices mostly tracking closely across the board.
We had reversed course and gotten more bullish on this index late last week and, indeed, still feel that it has some room to run left. More so than other indices in many cases. However, it's important to note that it is now sitting right below prior channel support of over a months duration. If it can clear this small hurdle then it has some room before running into the next significant technical resistance.


And it was another day of "VIX Gone Wild!" viewing pleasure. We started the day with a gap down from the already low level of 15.6 to a mind-bending 13.99 low! A plunge of over 10% and the first time hitting those level since June of '07. This early morning plunge, however, was followed promptly by a rebound. A rebound of over 14%. From an intraday low of 13.99 to the intraday high of 16.08, or +14.94% from bottom to top. After some large, erratic swings later on it settled down a tad before the closing bell to finish at 14.8, a drop of a bit over 5%. Incredible day for the VIX.
We believe the bottom is probably in for volatility and further, that it is unlikely to move sideways for any extended period. We'd love to hear you views.


Stay safe out there folks!


Check out our section on scrap gold buyers and how to get the most money for your scrap gold!

Sunday, March 11, 2012

Market Madness Weekly Market Update - 3/9/12


`It was an interesting week for US equity markets with significantly more volatility than we are used to seeing this year.

After a mild sell-off early in the week indices managed to recover their losses and finish positive by the close on Friday. The S&P 500, however, posted a gain of just 1.28 points--less than 0.001%--for the week. This doesn't seem so bad though if you consider the fact that it was down about 2.2% by late Tuesday afternoon. Meaning that the remaining three days mounted a rally of about 2.3% to finish where it did. Not bad overall. There was, however, some technical chart damage, some of which can be seen below. Aside from leaving behind a decidedly bearish candle formation several closely watched technical indicators also deteriorated. One of our personal favorites here at Market Madness is the ratio of SPX : RUT as a proxy for relative market strength (where generally trending higher=weaker market, lower=stronger market). This measure had been showing signs of turning upward since the beginning of February but has made a move lower this week. This will bear watching in coming weeks and if it makes a new high would argue for a more cautious approach moving forward.


The small cap RUT index was our best performer of the week, after two months of relative underperformance. Like other indices the RUT took a dive lower at week's open, down as much as 2%, but rebounded higher by Wednesday and continued on to finish up a respectable 1.88%, at 817 by Friday's close. That's a move from the midweek low, to the close of over +4%. It also moved us back inside previous channel support that was broken the week before. There has been tremendous technical strengthening in this index since last week's update and we have now seen the signs we had previously mentioned were needed to get positive on this index. It now seems likely that if equities strength resumes the small caps could now benefit more than their large cap peers. And certainly they should benefit more than they have been during the last couple months of this rally.


Not much comment here this week but to say that the tech composite remains relatively health technically speaking and very well could do quite nicely in a continuing bull rally. We don't believe this index is likely to give us much guidance as to overall market direction, however.


Ah the VIX. We've been somewhat harping on our VIX bottoming thesis for a couple weeks now. This week's action in our favorite volatility proxy has only reinforced this view. The VIX settled out the week sitting right at our support line after an impressive but short-lived spike upward early in the week as indices fell. Market Madness readers that are heavily invested in equities positions may want to take a good luck at buying some volatility as a hedge at this time. We believe that when this bottoming process completes, which we think it is heading towards doing, we could see a characteristic VIX spike, possibly up into the mid-20's, and probably very quickly and violently.


Thursday, March 8, 2012

Market Madness Daily Market Update - 3/8/12

It was a good day for bulls today.

The action driving headline of the day comes courtesy of the EZ:
"Greece Confident of Bond Swap Approval"
And later in the day...
"Greece Swap Deadline Passes as Investors Signal Deal"
While it's great that this chapter of the drama has been closed the most likely outcome will simply be the opening of the next, even more dramatic chapter. The EZ will be signing the blues for some time yet and will continue to negatively impact US firms and markets. But can US economic strength (if any exists) overwhelm EZ economic weakness?


After its largest 2-day gain since Mid-December the S&P 500 managed today to finish convincingly above its close of Monday. A key level in our analysis and one that we mentioned in a Mid-Day Madness blurb earlier would need to be crossed for confirmation of the nature of this pullback. Market Madness now feels that the verdict is in and that this rally will likely continue, for now. As we have pointed out previously both the duration and magnitude of pullbacks (and therefore volatility) has been steadily decreasing since the Oct. 4 bottom. This trend now has no more room to run as these pullbacks simply cannot get any smaller in duration and magnitude. If this market does indeed make another run upwards Market Madness' technical analysis suggests it is likely to be a relatively short, steep run followed by an equally short and steep decline as volatility first evaporates, and then explodes upwards. This analysis, however, is based solely on the technicals, and past price patterns of a similar nature and should be incorporated into a more complete analysis.

Another potentially positive development for this market rally was today's performance of tech, and high beta issues. The NASDAQ Composite measure finished the day with a gain of 1.18%, or 34.7 points, outperforming the large caps and DOW components by a respectable margin. Apple, of course, continues to be the driving force behind this index and where she goes, the index goes. Apple had a nice 2%+ day today, therefore dragging the COMP up along with it. Technicals overall improved significantly today and MACD and the COMP:SPX relative strength ratio in particular showed improvement, with the relative strength reading reversing its "sell" signal from the beginning of the week.

The strongest performance of the day though came from the small cap RUT index. She posted an impressive gain of over 1.3% today. This gain is made even more impressive by the fact that, in contrast to the other majors, the RUT actually fell sharply at the open, completely erasing its overnight gap up. By 11:15 EST, however, it had fought its way back up to even. From there it then proceeded to steadily drift upwards for the remainder of the day, closing at 806.34. This was the first day of technical improvement for this index in a shockingly long time. MACD readings flattened from decline and our RUT:COMP relative strength measure not only improved, but is now showing signs of a possible bottoming and reversal. This is one of the signs we previously said we would need to see to get bullish on this index. We are not there yet but today was a crucial first step.

The VIX volatility measure declined steeply again on today's gains, finishing down 1.12 points for a 5.87% loss. We believe that the bottom is basically in for the VIX. We have previously mentioned on several occasions our view that the VIX may have been forming a bottom over the last few weeks and our analysis is now suggesting that that process is near completion. We recommend keeping close tabs on the VIX over the next few days and watching for either a bounce off of, or a clean break through our multi-year bottom support at around the 16.5 level.

The last week has been an important "proving" event for this rally. If we can finish this week solidly in the green Market Madness will be much more positive on this market than we have been of late. This is largely because we believe that significant sidelined capital could come out to play if such an event comes to pass.

Stay safe out there!