Saturday, March 24, 2012

Global Gold Demand Trends

A fine article from our friends at GoldMoney.

Chinese gold imports will keep increasing

2012-MAR-18

Buy Gold with goldmoney hong kong office pictureSince China began to embrace economic progress in the 1990s and let the compelling forces of capitalism take hold to raise living standards in that country, its impact on world markets has been profound. Chinese capital has become a major influence in the global economy, and demand from China has had a huge impact on commodity prices. But an exception to the Chinese influence has been gold.
China has had little impact on world gold markets. The reason being that Chinese domestic gold production, which over the past several years has grown to make China the largest gold miner in the world, was sufficient to satisfy domestic demand. Consequently, in contrast to other markets in which China has become an important source of demand, it has had little impact on the demand for gold.
Just over a year ago, however, the balance between Chinese gold production and demand began to change. Chinese mining companies were unable to produce enough metal to satisfy the growing domestic demand, with the result that China began importing gold.
The trend for importing gold began modestly, and received little attention. But last year this growing trend started to get noticed. The Financial Times in September 2011, for example, reported: “Data from the Hong Kong government showed that China imported a record 56.9 tonnes [of gold] in September, a six-fold increase from 2010. Monthly gold imports for most of 2010 and this year run at about 10 tonnes, but buying jumped in July, August and September. In the three-month period, China imported from Hong Kong about 140 tonnes, more than the roughly 120 tonnes for the whole 2010.”
More recently, Reuters reported: “China imported nearly a fifth more gold from Hong Kong in November [2011] than the previous month, continuing a trend of sharply rising purchases that has seen bullion flows to the mainland more than treble in the first 11 months of the year. A record 102.525 tonnes of gold entered the mainland from Hong Kong in November, the Hong Kong Census and Statistics Department said.”
These are huge numbers. Last year India imported approximately 900 tonnes of the roughly 2,800 tonnes of gold mined last year. But China is rapidly closing the gap, and is likely to overtake India in the next few years. The impact on the global gold market from such an event, if it were to occur, would be profound and obviously very bullish. But even if China does not become the world’s largest gold importer, the inability of Chinese producers to mine enough metal to meet domestic demand will alone be very bullish for the gold price.
Given the above it is clear to see that China has become an important influence in the gold market and consequently, on the gold price. It is therefore another reason to remain bullish on the prospects for the metal of kings.

Author: James Turk
Buy Gold Online

Friday, March 23, 2012

Deflation or Inflation? The Debate Continues


What All Major Depressions Have in Common
Signs of deflation are visible but the public will be fooled 
March 23, 2012

By Elliott Wave International

Deflation requires a precondition: a major societal buildup in the extension of credit (and its flip side, the assumption of debt).
-- Conquer the Crash, 2nd edition (p. 88)
Has the United States met that precondition?
Well, consider that total credit market debt as a percent of U.S. gross domestic product was
  • 280 percent in 1929 at the start of the Great Depression
  • 380 percent in 2008
The current build-up of credit goes far beyond major -- it's unprecedented.
It's been rising steadily for 60 years. The slope literally looks like the side of a steep mountain.
Bank credit and Elliott wave expert Hamilton Bolton studied every major depression in the U.S. In 1957, he made this observation:
All were set off by a deflation of excess credit. This was the one factor in common...the signs were visible many months, and in some cases years, in advance. None was ever quite like the last, so that the public was always fooled thereby.
Let's read again from the second edition of Conquer the Crash (p.92):
A deflationary crash is characterized in part by a persistent, sustained, deep, general decline in people's desire and ability to lend and borrow...

The U.S. has experienced two major deflationary depressions, which lasted from 1835 to 1842 and from 1929 to 1932 respectively. Each one followed a period of substantial credit expansion. Credit expansion schemes have always ended in bust. The credit expansion scheme fostered by worldwide central banking...is the greatest ever...If my outlook is correct, the deflationary crash that lies ahead will be even bigger than the two largest such episodes of the past 200 years.
Is there evidence now that a deflationary trend is underway? Dear reader, the evidence is abundant and growing by the day.
To begin with, just a casual observation of our national economic life reveals a deep general decline in people's desire and ability to lend and borrow.
But there are many specific signs pointing to bankruptcy, default and a deflationary spiral.
Yet they're not grabbing the headlines. The "good" economic reports and levitating stock market are. The public will likely be fooled again. But make no mistake, the signs are there.

Learn Why Deflation Is the Biggest Threat to Your Money Right Now
Discover Robert Prechter's views on the unfolding deflationary trend by reading the 90-page report, The Guide to Understanding Deflation. This guide will help you survive a major deflationary trend, and even equip you to prosper.
Plan and prepare for your financial future. Download Your Free 90-Page Deflation Survival Guide eBook.
This article was syndicated by Elliott Wave International and was originally published under the headline What All Major Depressions Have in Common. EWI is the world's largest market forecasting firm. Its staff of full-time analysts led by Chartered Market Technician Robert Prechter provides 24-hour-a-day market analysis to institutional and private investors around the world.

Thursday, March 22, 2012

The Last Word

Sadly, the final Market Madness daily market updates will soon be written.

The time and effort required to provide the service is not proportional to its utility. In addition it has distracted from larger goals for Market Madness and is impeding progress towards those goals. A simple Cost/Benefit analysis says the daily updates simply have to go.

We'll be back Friday for the very last market update with the usual charts and analysis. Weekly updates may or may not continue much longer as the fact is, blogger is not a suitable long-term home for us. Therefore putting too much additional effort into it is not wise.

Stay safe out there!

Wednesday, March 21, 2012

Market Madness Daily Market Update - 3/21/12

Daily Stock Market Update and Index Charts for March, 21 2012


US indices traded around their flat lines for most of the day today with the conclusion being mixed results at the closing bell. The DOW saw the most downside pressure with a close at 13124 for a 45 point, -0.35% loss for the day. The S&P 500 index (SPX) fared a tad better losing just 2.63 points to close at 1402.89, a -0.19% loss. While the tech composite (COMP) did even better finishing just on the other side in the green for a 1.17 point, 0.04% gain for the day to close at 3075.32. A relatively calm day today, our volatility measure, the VIX, gave up about half a point to close just above 15 at 15.13, a 2.89% decline.


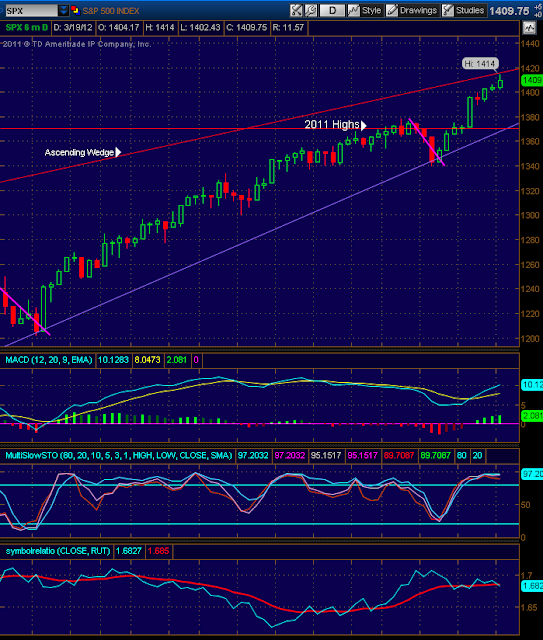
Moving on to our charts today first up is the S&P (SPX). Unsurprisingly technicals deteriorated somewhat today with MACD further declining and both trend and momentum indicators losing some ground across the board. Our multi-stochastics indicator, however, has not yet confirmed its turn out of overbought territory. Right now most evidence seems to point towards this being a "cooling off" period before the next leg rather than a full-on profit taking situation. Of course, anything could happen tomorrow as we all know all too well.

daily stock market update with index chart for SPX

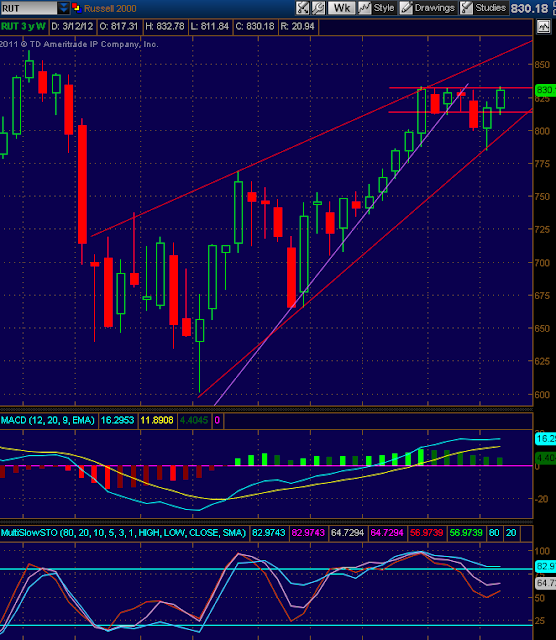
The small cap RUT index "outperformed" today by actually gaining a little ground. A very very little ground. Now right back in its long-standing channel this index has a bit of work to do before undoing the technical damage caused by Tuesday's losses. Assuming it can overcome those obstacles the RUT should still be in a good position for relative outperformance. We'll need to see either this 820-830 area successfully tested as new support or a convincing break of its recent highs to get back on the bull side of this trade. Overall technicals did worsen for the index despite the meager gains.
MACD fell a bit farther today but the RUT : COMP ratio flattened out a bit which certainly could be a positive if followed through on. Our multi-stochastic measure, however, is on the verge of confirming its rollover out of overbought. Which could actually be a good thing--relieving that pressure--if this is the worst of it, or at least close to the worst of it.

daily stock market update with index chart for RUT

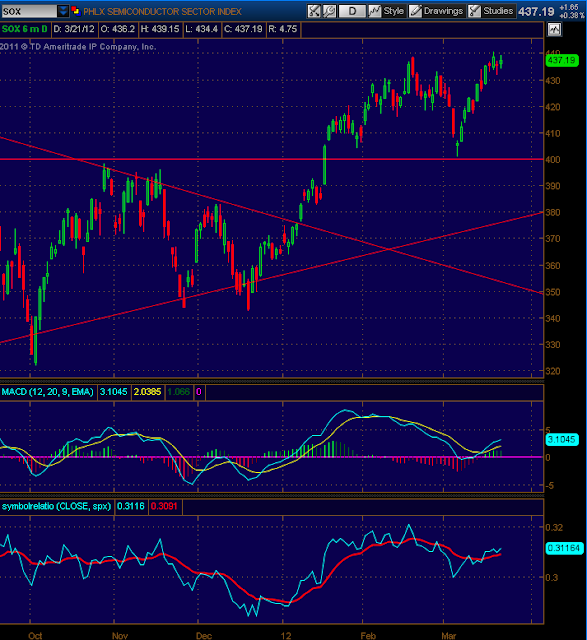
The semiconductors truly did "outperform" today. The SOX index posted gains of 1.65 points to close at 437.19. A gain of 0.38%, besting its peers by a wide margin. We remain relatively bullish on this index if it can crack that resistance at 440. Technicals here were mixed today and provide little insight overall. MACD deteriorated a bit, stochastics continue to turn out of overbought, and the SOX : SPX relative strength measure showed improvement. Both trend and momentum indicators of a wide variety are showing mixed results and right now price action is the very best indicator for this index (well for any index any time, really).

daily stock market update with index chart for SOX

Still not feeling well so that's it for today folks!
Stay safe out there!

Tuesday, March 20, 2012

Market Madness Daily Market Update - 3/20/12

Market Update and Index Charts for March 20, 2012

Due to a nasty cold we're going to attempt to keep it very brief today.

US markets pulled back a bit today with the DOW losing about -.5% to close at 13170 and the S&P 500 giving up just over 4 points, or -0.3% to close at 1405. The tech composite (COMP) shed a mere 4 points -(0.14%) to close at 3074. All closed well off the lows of the day after a morning gap down followed by steady improvement through the rest of the day.

The SPX pulled back from the top of its ascending wedge formation this morning but fought back up to close well within Monday's range. That's a plus. On the negative side, however, the narrowing of losses throughout the day was not enough to prevent some technical weakening. MACD flattened out, the SPX : RUT relative strength ratio turned up, and stochastics started to turn out of overbought territory. None of this is damage that couldn't be undone with a strong day or two.


The small cap Russell 2000 index (RUT) saw the worst of it and did not recover from the morning gap down nearly as well as other indices. For the day it posted a loss of over 1%, or 8.53 points to close at 829.24. Right back inside that long-standing channel. The big question now is: will this level now provide some support? Technicals took a fairly sharp turn for the worse today with MACD turning down and the
RUT : COMP ratio continuing its decline. Stochasitics also rolled over steeply today but are not yet all in agreement. We should get more clarity very soon.


Is the VIX bottoming thesis dead? (long live the VIX bottoming thesis?)
Well we report you decide but it looks like a distinct possibility. Personally we would need to see a fairly sharp move up to above the red line there around 19. And we would need to see it relatively soon. Like by the end of next week tops.Failing that occurring we would be very cautious on drawing any conclusions at all from VIX action in the near future. The VIX gained about 4% again today with .56 point rise to close at 15.60. That is a rise of about 14% from its lows but at these extreme lows moves of that magnitude--in both directions--are not uncommon at all and really do not impart any useful information.


Monday, March 19, 2012

Are the Efforts of the World Central Banks Working?


Are the Efforts of the World Central Banks Working?

March 19, 2012

By Elliott Wave International

The Fed is not the world's only central bank dealing with debt. Watch as Steve Hochberg, EWI's chief market analyst, shows what has happened to GDP in countries around the world as other central banks try to "inject liquidity" into the system.


Market Madness Daily Market Update - 3/19/12

Daily Market Update and Commentary for March 19, 2012


Another day in the green for the major indices today.

The DOW had the weakest showing with a paltry 6.5 point, 0.05% gain to finish at 13239 at the close.
The CBOE Volatility index (VIX) advanced today despite the gains in the SPX with a .57 point, 3.94% move up from its very low levels to close at just over 15.

The S&P 500 had a much better showing than the DOW and was up almost 10 points late in the day before settling down a little to finish at 1409.75. A respectable gain of about 5.5 points, or 0.4%. The index backed off its highs after approaching the top of our ascending wedge formation but it is quickly running out of room and this will resolve one way or another imminently.

Technicals further improved with MACD gaining more ground and the SPX : RUT moving lower once again. A positive for continuing market strength. Stochastics remain in overbought territory on the daily time frame but show no signs of rolling over yet.

Stock market index charts and analysis - SPX


The start of the show today was, of course, the small cap RUT index. We've been increasingly bullish on this index starting after the first week of March (see here, herehere, etc.) and its break today of that stubborn upper channel resistance may bring a new phase to this rally. It should, at the very least, now have a solid base of support around the 830-820 level. For the day the index saw a gain of about 7.5 points, 0.91% to close at 837.77.
A handy outperformance of its major peers.

We love this index under any conditions of continuing overall market strength and it has a high probability of continuing outperformance of its peers under this scenerio.

Stock market index charts and analysis - RUT

The semiconductors (SOX) also performed admirably today with 0.75%, 3.28 point gain to 438.69 at the close. We've been constructive on this index as well lately (here, here) but this one is now sitting right at technical resistance. If, however, it can break convincingly through that 440 mark it too should have some more room to run for relative outperformance. Technicals also saw improvement here today with both MACD and Stochastics registering gains.

Stock market index charts and analysis - SOX


Take care and stay safe out there!

Sunday, March 18, 2012

Market Madness Weekly Market Update - 3/16/12


Index Charts and Commentary for Week of March, 16, 2012

I hope everyone had a great weekend!

It was an outstanding week for US markets with new "recovery" highs for most major indices. Getting right to the charts today we start with the S&P 500 index (SPX) below. It now seems likely that even in the event of a pullback we should find significant buying support around those 2011 highs at 1370. That's about a 2 1/2 percent correction from here. Technicals improved this week with stochastics reversing higher and avoiding a confirmed turn out of overbought and with a strengthening in MACD. While we remain cautious on the macro fundamentals it is difficult to argue with this price action. From a technical standpoint most evidence points to a continuing rally for now.

S&P 500 (SPX) Index Chart and technical analysis

The small cap Russell 200 index has been an interesting one to watch over the last few weeks with this week being no different. The improvement in technicals this week was pronounced despite a slow start and after regaining its channel it went on to move quickly back up to the upper bounds of that channel. This has been stubborn resistance and it has failed so many times now one would think it will soon resolve one way or another. Either with a convincing break through and a shot at its own 2011 highs or a failure and sharp break down to new lows of the year.
MACD flattened out from its decline this week while stochastics avoided confirming the turn out of overbought. These are just the sort of improvements we had written previously that we needed to see and this index has gone from ugly duckling to diamond in the rough in the process. A break of that channel resistance should position the RUT for outperformance under any scenario of continuing market strength.

Russell 2000 (RUT) Index Chart and technical analysis


Another potentially attractive area were market strength to continue is the semiconductor index (SOX). This index is just in great shape and with its recent successful test of 400 and subsequent strong rally could be getting set to run. Any cross over 440 should establish a nice base from which to continue the move on up to its March '11 highs at 474. Technicals also improved markedly with MACD advancing and stochastics turning around sharply.

Semiconductor (SOX) Index Chart and technical analysis

And last up as usual we have the VIX. One way or another our VIX bottoming thesis is going to see a resolution imminently. It was a wild week for the VIX and at one point it even reached levels not seens in nearly 5 years, at 13.99 low. Indeed it finished the week not far from there at 14.47, a decline of  about 8.4%. We feel this may be the culmination of the bottoming process but it if is not then we should know that very soon. As we said, one way or another resolution is coming for this view. The white line tacked on below represents what we would probably need to see in the way of a breakout for confirmation of this. 

VIX Volatility Chart and technical analysis

See you for our manic monday report! Stay safe out there!

Effect of derivative trading on volatility of underlying stocks

The effect of derivative trading on volatility of underlying stocks: evidence from the NSE.


Chart of VIX - Volatility


It is an issue of interest as to how introduction of futures trading affects volatility of underlying stocks, have made the issue interesting for both exchanges and regulators. Introduction of futures trading might increase spot market volatility due to low transaction cost and high degree of leverage in futures market. The speculators in derivative market attempt to influence the spot index underlying futures contract, through excessive buying or selling of the underlying index constituents, the volatility of these stocks could increase. The excessive volatility in stock market significantly affects on risk-averse investor, corporate capital investment decisions, leverage decisions and consumption patterns .Therefore, it is important to study the impact of futures trading on individual stocks volatility which has considerable interest for regulator.

The introduction of derivatives trading has received considerable attention. It has led to controversy over the effect of futures trading on volatility underlying assets. Some studies supported the argument that introduction of futures trading stabilizes spot market by decreasing its volatility. This is due to migration of speculative traders from spot to futures market. Futures' trading is expected to improve market efficiency and reduce informational asymmetries. The studies by Baldauf and Samtoni (1991) using the S&P 500 index in US, Darram (2000) using the FITSE Mid 250 contract in UK, Bologna (2002) using MIB 30 in Italy, and Raju and Kardnde (2003) using NSE 50 in India, support this view. They have shown a decline in the spot market volatility upon introduction of futures trading. 

There are also studies which have supported that introduction of futures trading increased spot market volatility thereby destabilizing the market, as futures market promotes speculation and high degree of leverage. Harris (1989), Lee and Ohk (1992), have supported the destabilizing hypothesis. Thus, several of studies on introduction of futures trading on stock market volatility have been inconclusive. In the light of this background, the present study seeks to empirically investigate whether introduction of futures trading decreases or increases stock market volatility. 


There has been a debate about how introduction of index futures trading influence cash market volatility. The moot question has been whether introduction of futures trading stabilizes or destabilizes stock market volatility. The results reveal that spot market volatility has declined after introduction of futures trading. In case of individual stocks, there has been a reduction in volatility of twenty individual stocks with the exception of ABB, CIPLA, ITC, ICICI, INFOSYS, RANBAXY and SIEMENS. Further, introduction of futures trading has altered the asymmetric response behavior both of spot price volatility as well individual stock volatility. Overall, introduction of futures markets improves the quality of information flowing to spot markets, and spot prices accordingly reflect more promptly changes that occur in demand and supply conditions. The finally results show that futures trading has significant role in reducing volatility of the S&P CNX Nifty, but market wide factors do not help to reduce the market volatility.

I think it is pretty clear to most of us by now that indeed, volatility has increased with the growth of derivatives trading.  

Blog Update

Sorry about the flood of posts!

Sadly, with blogger post-pages is about the only way to create more than 10 content, or "static" pages.

We'll always try and implement these updates overnight and then quickly bury them in your regular daily market updates and index charts. It will be a better Market Madness for it so bear with me.

Thanks for your patience!

Curtis,
Market Madness

Optionetics Options News and Trading Strategy Articles

Become a Master Options Trader!

Options Trading and Strategy Articles

More twitch-than-witch greets bulls and bears as a less-than-mad March contract comes off the board.

A profitable "to close" sale is always nice, but there may be better options to consider first.

Although Elliott Wave Analysis can be complex, those who are newer to the topic may want to simplify their assessment by considering basic EW rules & guidelines.

One $600 Apple product and a "1400 doji app" is keeping the bull somewhat under wraps Thursday.

Money continues to grow on trees for a confident, apple-noshing bull, but gravity looks due for an appearance.


Strong gains square off with overly-complacent behavior in not-so-stressful testing Wednesday.

Confident behavior turns decidedly convinced of itself as bulls go shopping in front of this afternoon's FOMC meeting.

Instead of reaching for the clouds with Vmware's breakout, grounded investors might want to look at the outfit's bull vertical markets for stronger positioning.

News and Expert Analysis from optionMonster

Click Here and Master Options! Condor Options Analysis and Commentary Blog

What put surge means for materials fund

The SPDR Materials Fund has been pushing back toward the resistance levels from the last six weeks, but put buying tops its option activity today.

Group One's Jamie Tyrrell is seeing heavy activity in the VIX 17 puts, indicating that traders don't see the volatility index falling much below that level even though the market is up again today.

The construction company has been surging after it touched a 2-1/2 year low last year and following a strong earnings release in December.

The gold miner's stock has been falling sharply for more than a month, but today one trader is looking for a floor beneath the shares.

Nearing the halfway mark in today's session, here are the individual equity names with the most call and put buying on optionMONSTER's ActionTracker data system.

Total option volume remains strong with 6.8 million contracts already traded today, and calls are again strong in the indexes and ETFs, optionMONSTER's data systems show.

The iShares Barclays 20+ Year Treasury Bond Fund collapsed to support this week, and today's option activity is dominated by a large put trade.

The electronics retailer is holding yesterday's impressive gains but remains in the range that has been in place for all of this year.

Yesterday may have been the day that retail showed its true colors, when we discovered that $4 gasoline does matter.

The Chinese videogame developer beat expectations on both the top and bottom lines; Frontline climbs on bullish commentary; Cogo more than doubles on CEO plans.

European markets are gaining for the fifth day in a row as worries over the Greek debt situtation subside. Asian indexes close mixed.

The highly leveraged and heavily shorted commercial real-estate lender has been trading sideways since late January, when it reported better-than-expected earnings as bad loans declined.

Some chart watchers may see evidence that the Canadian miner remains in a bullish trend, and they could be looking for its next move to be higher.

The SPDR Consumer Discretionary Fund drew a large put ratio spread yesterday even as the ETF hit new all-time highs.

The pharmaceutical company missed forecasts in its last earnings report but continues to enjoy rapid growth for its Xiaflex treatment of a rare hand disease.

One investor has seen premiums double but, instead of taking profits, is raising the stakes even higher to reap more gains on the financial name.

Chris McKhann analyzes a large put backspread in the pharmacy-services company, which appears to be an example of serious tail-risk hedging.

Today's economic calendar will focus on the inflation data, consumer sentiment, and industrial production.

The CBOE Volatility Index surged at yesterday's close to finish the day up 0.72 percent at 15.42, taking a chunk out of the premium in the VIX futures.

The SPX reclaimed the elusive 1400 level with conviction, finishing yesterday at 1402.60. The Russell 2000 recouped Wednesday's losses, and the Nasdaq 100 gained even though Apple fell.