Daily Stock Market Update and Index Charts for March, 21 2012
Moving on to our charts today first up is the S&P (SPX). Unsurprisingly technicals deteriorated somewhat today with MACD further declining and both trend and momentum indicators losing some ground across the board. Our multi-stochastics indicator, however, has not yet confirmed its turn out of overbought territory. Right now most evidence seems to point towards this being a "cooling off" period before the next leg rather than a full-on profit taking situation. Of course, anything could happen tomorrow as we all know all too well.
The small cap RUT index "outperformed" today by actually gaining a little ground. A very very little ground. Now right back in its long-standing channel this index has a bit of work to do before undoing the technical damage caused by Tuesday's losses. Assuming it can overcome those obstacles the RUT should still be in a good position for relative outperformance. We'll need to see either this 820-830 area successfully tested as new support or a convincing break of its recent highs to get back on the bull side of this trade. Overall technicals did worsen for the index despite the meager gains.
MACD fell a bit farther today but the RUT : COMP ratio flattened out a bit which certainly could be a positive if followed through on. Our multi-stochastic measure, however, is on the verge of confirming its rollover out of overbought. Which could actually be a good thing--relieving that pressure--if this is the worst of it, or at least close to the worst of it.
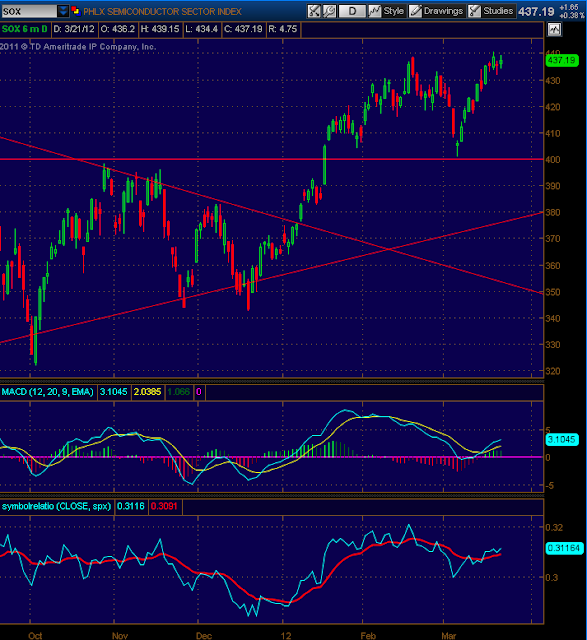
The semiconductors truly did "outperform" today. The SOX index posted gains of 1.65 points to close at 437.19. A gain of 0.38%, besting its peers by a wide margin. We remain relatively bullish on this index if it can crack that resistance at 440. Technicals here were mixed today and provide little insight overall. MACD deteriorated a bit, stochastics continue to turn out of overbought, and the SOX : SPX relative strength measure showed improvement. Both trend and momentum indicators of a wide variety are showing mixed results and right now price action is the very best indicator for this index (well for any index any time, really).
Still not feeling well so that's it for today folks!
Stay safe out there!


No comments:
Post a Comment