Thursday, March 8, 2012

Elliot Wave Principle Book Review


Elliot Wave Principle Book Review

I recently completed reading an interesting technical analysis book entitled "Elliot Wave Principle" by a man named Robert Prechter, president of Elliot Wave International, and found it to be worth reviewing. Though I got the hardback for myself you can actually get a complimentary copy in ebook form. I just can't read ebooks of any substantial length myself.

This book is a must for anyone who believes that there is method to the stock Market Madness.

The wikipedia entry for "Elliot Wave Principle" states that it is "a form of technical analysis that investors use to forecast trends in the financial markets and other collective activities.”

Elliot Wave Theory was developed by a man named Ralph Nelson Elliot in the 1930's and refined through the 40's that attempts to use recurring past price patterns to predict future prices (the basis of all technical analysis).  Elliot found that market prices form repeated waves, on any time scale one cared to look at, no matter how small or how large (the concept of fractals can be useful here). And he found that these waves come in basic patterns.

Elliot believed that these waves consistently come in a 5-wave pattern in the direction of the "parent" (main) trend, followed by a 3-wave pattern against that trend. In the 5-wave pattern (called the "Motive" phase) you would have waves 1,3, and 5 following the main trend and waves 2 and 4 acting as "correction" waves.
Then we come to the 3-wave pattern, going against the main trend, in which it is waves 1 and 3 that are the "corrective" waves and wave 2 is a "distraction" wave. The above described process constitutes one complete cycle (for a given scale).

Is this making any sense to you? Probably not and I know it really didn't for me. Which is why I ended up buying the book for myself. While not overly complex (anyone can understand and do it) it is also not a simple method of analysis and is best explained by the experts. Of which I am most certainly not one which is why I do recommend this book for anyone curious about Elliot Wave Analysis.

It is not a book about day-trading or a book full of promises that you can get rich quick trading. You will be sorely disappointed if that is what you're after, which you shouldn't be anyway. It is a book about mass social psychology, market behavior, and market history. And about how these things can work for you if you understand them. What it is is an interesting and very worthwhile book that will add to your market understanding and, if applied properly, help you be more profitable in your trading or investing. You've probably heard of Fibonacci mathematics and may even use them to some degree in your technical analysis. Well, this book is full of Fibonacci mathematics concepts (don't worry, you won't be doing any advanced maths yourself) and that content alone makes the book worth the read.

Prechter's book attempts to teach you how to spot the Elliot wave patterns, and therefore be able to predict more accurately where the market (or single stock issue) might go next based on where it currently is in the cycle. Prechter's Elliot Wave Principle does an admirable job of imparting to readers all they need to know to get started right away incorporating basic, and advanced wave analysis into their trading arsenal. Elliot Wave Analysis has a large following of technical analysts all over the world and has stood the test of time for over 70 years

Prechter has made some epic calls over the years but he has also taken a lot of heat lately over his calls over the last couple years for a coming "deflationary depression."
The fact of the matter is though that it is much much too early to call him wrong at this point (though I myself am not in the deflation camp).

We think it's definitely worth a read. Especially for free.


Market Madness Daily Market Update - 3/8/12

It was a good day for bulls today.

The action driving headline of the day comes courtesy of the EZ:
"Greece Confident of Bond Swap Approval"
And later in the day...
"Greece Swap Deadline Passes as Investors Signal Deal"
While it's great that this chapter of the drama has been closed the most likely outcome will simply be the opening of the next, even more dramatic chapter. The EZ will be signing the blues for some time yet and will continue to negatively impact US firms and markets. But can US economic strength (if any exists) overwhelm EZ economic weakness?


After its largest 2-day gain since Mid-December the S&P 500 managed today to finish convincingly above its close of Monday. A key level in our analysis and one that we mentioned in a Mid-Day Madness blurb earlier would need to be crossed for confirmation of the nature of this pullback. Market Madness now feels that the verdict is in and that this rally will likely continue, for now. As we have pointed out previously both the duration and magnitude of pullbacks (and therefore volatility) has been steadily decreasing since the Oct. 4 bottom. This trend now has no more room to run as these pullbacks simply cannot get any smaller in duration and magnitude. If this market does indeed make another run upwards Market Madness' technical analysis suggests it is likely to be a relatively short, steep run followed by an equally short and steep decline as volatility first evaporates, and then explodes upwards. This analysis, however, is based solely on the technicals, and past price patterns of a similar nature and should be incorporated into a more complete analysis.

Another potentially positive development for this market rally was today's performance of tech, and high beta issues. The NASDAQ Composite measure finished the day with a gain of 1.18%, or 34.7 points, outperforming the large caps and DOW components by a respectable margin. Apple, of course, continues to be the driving force behind this index and where she goes, the index goes. Apple had a nice 2%+ day today, therefore dragging the COMP up along with it. Technicals overall improved significantly today and MACD and the COMP:SPX relative strength ratio in particular showed improvement, with the relative strength reading reversing its "sell" signal from the beginning of the week.

The strongest performance of the day though came from the small cap RUT index. She posted an impressive gain of over 1.3% today. This gain is made even more impressive by the fact that, in contrast to the other majors, the RUT actually fell sharply at the open, completely erasing its overnight gap up. By 11:15 EST, however, it had fought its way back up to even. From there it then proceeded to steadily drift upwards for the remainder of the day, closing at 806.34. This was the first day of technical improvement for this index in a shockingly long time. MACD readings flattened from decline and our RUT:COMP relative strength measure not only improved, but is now showing signs of a possible bottoming and reversal. This is one of the signs we previously said we would need to see to get bullish on this index. We are not there yet but today was a crucial first step.

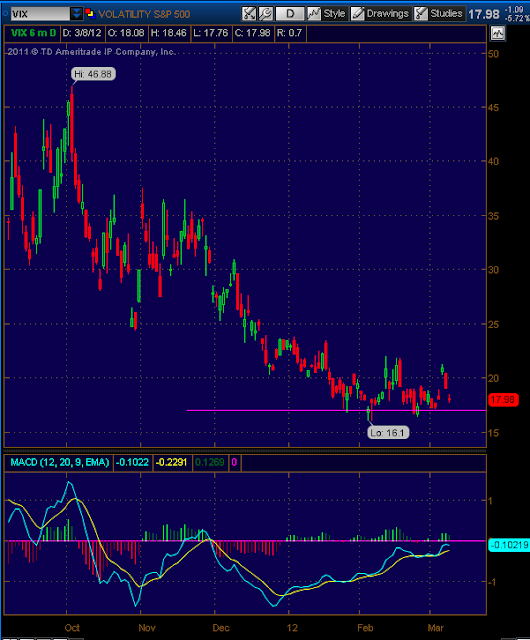
The VIX volatility measure declined steeply again on today's gains, finishing down 1.12 points for a 5.87% loss. We believe that the bottom is basically in for the VIX. We have previously mentioned on several occasions our view that the VIX may have been forming a bottom over the last few weeks and our analysis is now suggesting that that process is near completion. We recommend keeping close tabs on the VIX over the next few days and watching for either a bounce off of, or a clean break through our multi-year bottom support at around the 16.5 level.

The last week has been an important "proving" event for this rally. If we can finish this week solidly in the green Market Madness will be much more positive on this market than we have been of late. This is largely because we believe that significant sidelined capital could come out to play if such an event comes to pass.

Stay safe out there!

A Mid-Day Madness Blurb

Markets have fought valiantly higher today to approach Monday's closing level as of this writing. Supposedly on "Greek deal hopes."

Market Madness would need to see a close above Monday's level before concluding the pullback is over, however. That we are seeing this rebound on a day when unemployment claims are up, and the Greece situation is unchanged (media chaeerleading aside) does suggest that this is indeed a simple pullback.

See you for our Daily Market Madness Recap!